Goodness of Fit and Shepard Plot for Nonmetric Multidimensional Scaling
goodness.metaMDS.RdFunction goodness.metaMDS find goodness of fit measure for
points in nonmetric multidimensional scaling, and function
stressplot makes a Shepard diagram.
Usage
# S3 method for class 'metaMDS'
goodness(object, dis, ...)
# Default S3 method
stressplot(object, dis, pch, p.col = "blue", l.col = "red",
    lwd = 2, ...)
Arguments
- object
- dis
Dissimilarities. This should not be used with
metaMDSormonoMDS, but must be used with when the dissimilarities cannot be reconstructed from the result object.- pch
Plotting character for points. Default is dependent on the number of points.
- p.col, l.col
Point and line colours.
- lwd
Line width. For
monoMDSthe default islwd = 1if more than two lines are drawn, andlwd = 2otherwise.- ...
Other parameters to functions, e.g. graphical parameters.
Details
Function goodness.metaMDS finds a goodness of fit statistic
for observations (points). This is defined so that sum of squared
values is equal to squared stress. Large values indicate poor fit.
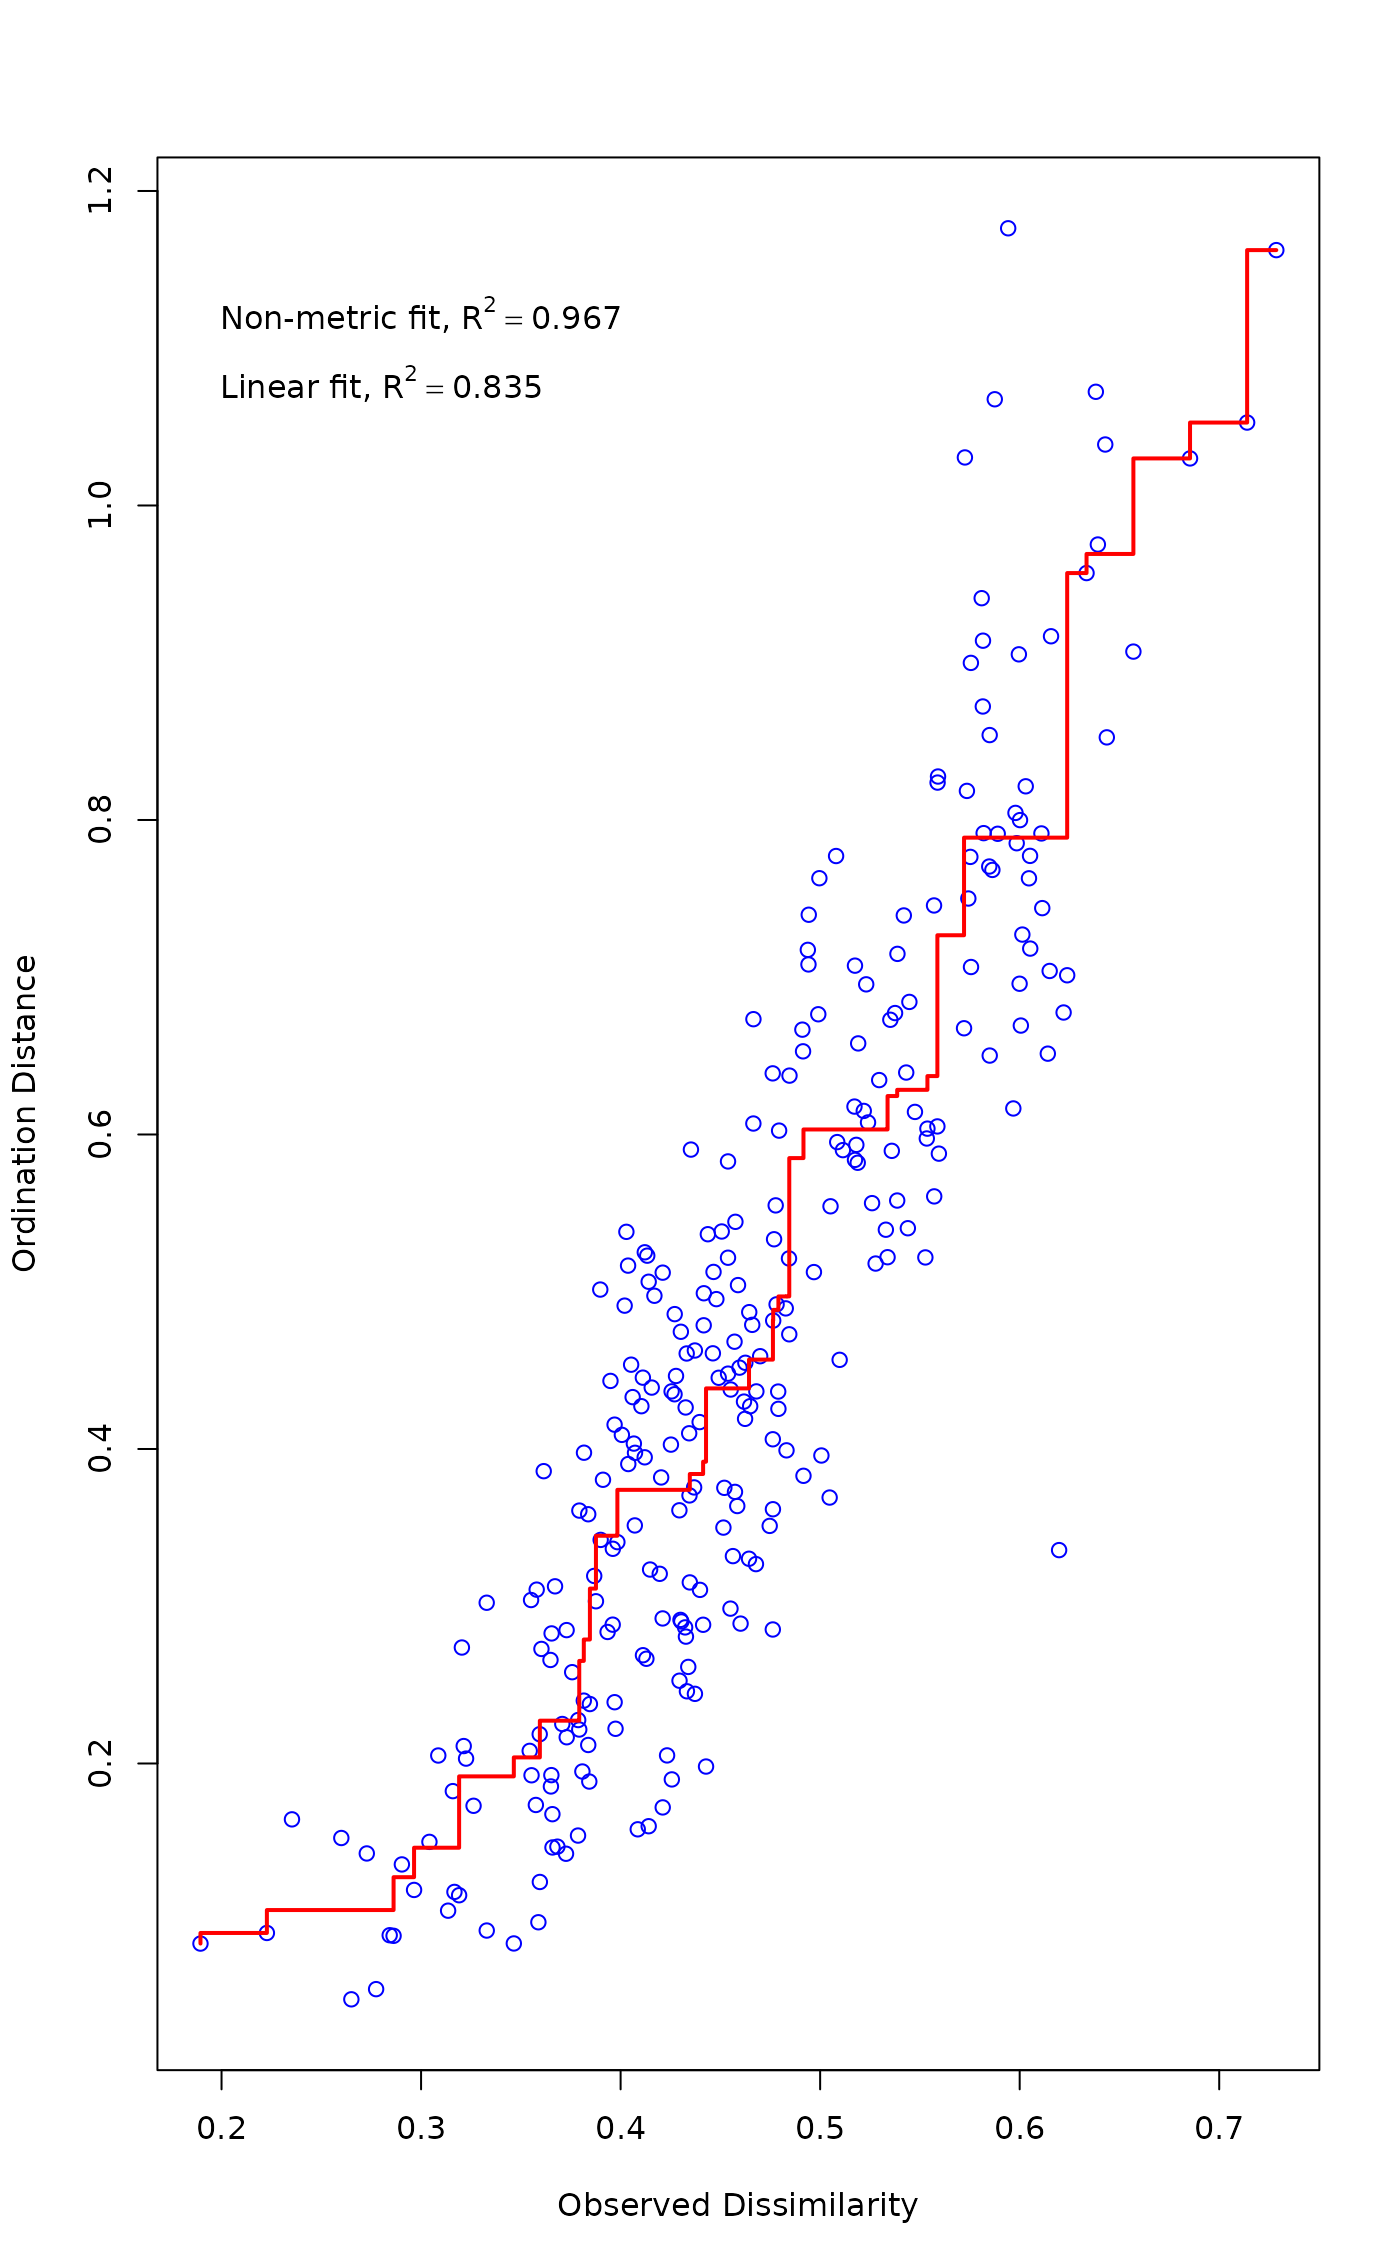
Function stressplot draws a Shepard diagram which is a plot
of ordination distances and monotone or linear fit line against
original dissimilarities. In addition, it displays two
correlation-like statistics on the goodness of fit in the graph.
The nonmetric fit is based on stress \(S\) and defined as \(R^2
= 1-S^2\). The “linear fit” is the squared
correlation between fitted values and ordination distances. For
monoMDS, the “linear fit” and \(R^2\)
from “stress type 2” are equal.
Both functions can be used with metaMDS,
monoMDS and isoMDS. The original
dissimilarities should not be given for monoMDS or
metaMDS results, but they must given if the result
object has no information to reconstruct dissmilarities. The
functions checks that dissimilarities are consistent with current
ordination, and refuses to analyse inconsistent dissimilarities.
Function goodness.metaMDS is generic in vegan, but you
must spell its name completely if the result has no class.
Value
Function goodness returns a vector of values. Function
stressplot returns invisibly an object with items for
original dissimilarities, ordination distances and fitted values.
See also
metaMDS, monoMDS,
isoMDS, Shepard. Similar
diagrams for eigenvector ordinations can be drawn with
stressplot.wcmdscale, stressplot.cca.
Examples
data(varespec)
mod <- metaMDS(varespec)
#> Square root transformation
#> Wisconsin double standardization
#> Run 0 stress 0.1843196
#> Run 1 stress 0.2539178
#> Run 2 stress 0.1852397
#> ... Procrustes: rmse 0.05468952  max resid 0.1467652
#> Run 3 stress 0.1969805
#> Run 4 stress 0.1858401
#> Run 5 stress 0.195049
#> Run 6 stress 0.195049
#> Run 7 stress 0.2088293
#> Run 8 stress 0.2683832
#> Run 9 stress 0.2152683
#> Run 10 stress 0.1974407
#> Run 11 stress 0.1858401
#> Run 12 stress 0.2126568
#> Run 13 stress 0.2028828
#> Run 14 stress 0.18458
#> ... Procrustes: rmse 0.04934883  max resid 0.1574807
#> Run 15 stress 0.2225662
#> Run 16 stress 0.2260368
#> Run 17 stress 0.1969805
#> Run 18 stress 0.18584
#> Run 19 stress 0.18458
#> ... Procrustes: rmse 0.04936088  max resid 0.1575449
#> Run 20 stress 0.2382107
#> *** Best solution was not repeated -- monoMDS stopping criteria:
#>     17: stress ratio > sratmax
#>      3: scale factor of the gradient < sfgrmin
stressplot(mod)

gof <- goodness(mod)
gof
#>  [1] 0.02956469 0.03430702 0.04592481 0.04040796 0.04187011 0.03236186
#>  [7] 0.03348066 0.03063679 0.03137986 0.02968139 0.03368516 0.02593700
#> [13] 0.03839481 0.03420649 0.02954537 0.02675709 0.04274281 0.03775021
#> [19] 0.06790979 0.03251617 0.02990184 0.03040698 0.05487495 0.04078682
plot(mod, display = "sites", type = "n")
points(mod, display = "sites", cex = 2*gof/mean(gof))
gof <- goodness(mod)
gof
#> [1] 0.02956469 0.03430702 0.04592481 0.04040796 0.04187011 0.03236186
#> [7] 0.03348066 0.03063679 0.03137986 0.02968139 0.03368516 0.02593700
#> [13] 0.03839481 0.03420649 0.02954537 0.02675709 0.04274281 0.03775021
#> [19] 0.06790979 0.03251617 0.02990184 0.03040698 0.05487495 0.04078682
plot(mod, display = "sites", type = "n")
points(mod, display = "sites", cex = 2*gof/mean(gof))
